
How to leverage customer feedback to boost your e‑commerce sales
You should systematically collect and analyze customer feedback to uncover pain points that cost conversions and opportunities that drive repeat purchases, then prioritize changes that improve your UX, product descriptions, and post-purchase service; by turning feedback into measurable experiments you can increase trust, reduce churn, and lift revenue while mitigating reputational risks.
Key Takeaways:
- Collect feedback at every touchpoint (post-purchase surveys, on-site widgets, social, customer service) to capture actionable insights.
- Analyze and segment feedback by theme, product, and customer cohort to prioritize fixes and feature requests.
- Turn insights into product and UX improvements - iterate quickly on high-impact issues to reduce churn and increase conversion.
- Showcase authentic reviews, ratings, and user-generated content across product pages and ads to build trust and boost average order value.
- Close the loop: respond publicly to feedback, follow up with dissatisfied customers, and use positive testimonials in targeted marketing and personalization.
The strategic value of customer feedback
Driving conversion and customer lifetime value
When you surface reviews, ratings, and verified-purchase badges on product pages, conversion lifts of 10-300% are common across categories, with larger uplifts on considered-purchase items like electronics and mattresses. Embedding short excerpts from 4-5 star reviews above the fold and adding a user-generated photo carousel can increase click-to-cart rates while reducing hesitation-one mid-market apparel seller reported a 7% rise in average order value and a 15% increase in repeat purchases after prioritizing visual feedback and Q&A.
By using feedback to power personalized campaigns-segmenting users by sentiment, past issues, or product affinity-you convert one-time buyers into loyal customers. Implementing targeted post-purchase journeys based on survey responses (for example, offering fit tips to shoppers who flagged sizing problems) commonly raises customer lifetime value by improving retention rates by 5-20% and lowering churn among high-value cohorts.
Informing product‑market fit and roadmap decisions
When feature requests, return reasons, and open-text reviews cluster around the same themes, you get quantifiable signals for roadmap prioritization; if >20-30% of feedback mentions the same missing feature or defect, treat it as a high-priority product bet. Use vote systems on feature requests and track changes in NPS across cohorts-companies that systematically route qualitative feedback into quarterly roadmaps reduce failed feature launches and accelerate time-to-fit.
By combining structured metrics (NPS, CSAT, return rates) with topic modeling on reviews, you can estimate opportunity size before you build: for example, identifying that 28% of device complaints relate to battery life lets you forecast the impact of a hardware revision on returns and retention. Teams that adopt this approach typically shorten the discovery cycle and increase successful launches.
More info: implement an outcomes-based prioritization: link each feedback theme to a specific KPI (conversion, retention, returns), assign expected delta and confidence, then prioritize items with the highest expected value per engineering week-this disciplined process moves you from opinion-driven roadmaps to evidence-driven decisions.
Lowering support costs and return rates
When you analyze support tickets and product reviews together, common pain points surface-size confusion, unclear care instructions, or fragile components-and you can fix the root cause instead of treating symptoms. Adding robust size charts, user-uploaded fit photos, and a short “what to expect” video reduced returns for several fashion retailers by 15-25%, and automated FAQ articles based on top ticket themes cut inbound queries by 30-50% for those teams.
By turning recurring issues into proactive content and product updates, you reduce both return-related costs and human support hours. Routing high-frequency complaint types into self-service flows (chatbot answers, interactive diagnostics, return-prevention tips) lowers average handle time and frees agents to resolve complex cases, which improves CSAT without increasing headcount.
More info: track the ROI of remediation work by measuring ticket volume, average handle time, and return rate pre- and post-fix; prioritize fixes that deliver the largest combined reduction in returns and support time per dollar spent.
Collecting feedback: channels, timing, and tactics
On‑site mechanisms: widgets, in‑app prompts, and chat transcripts
You can capture immediate intent by placing targeted widgets and microsurveys on high‑value pages: product pages, cart/checkout, and post‑checkout confirmation. Configure triggers by behavior-after 30-60 seconds on a product page, after 50% scroll depth, or on exit intent-and expect baseline response rates of 2-10% for passive widgets and 10-25% for behaviorally targeted prompts. Tools like Hotjar, Qualaroo, and Intercom let you route responses into segments so you tie feedback to SKU, cohort, or user lifetime value.
Use chat transcripts from live agents and bots as a continuous, high‑signal feed: tag recurring complaints (size, fit, shipping time) and feed them into your issue tracker weekly. While quick surveys give quantifiable metrics, transcripts reveal language and friction points; extract the top 10 themes monthly and prioritize fixes that affect the largest revenue buckets, because over‑prompting can raise abandonment rates and degrade conversion.
Transactional feedback: post‑purchase surveys (NPS, CSAT) and order follow‑ups
You should time transactional surveys to match the customer experience moment: send CSAT or delivery satisfaction surveys within 24-72 hours after delivery, and schedule NPS 30-90 days after a meaningful relationship milestone (first repeat purchase or a completed onboarding). Typical email response rates vary-expect 10-30% for transactional emails and higher (20-50%) when you combine email plus in‑app push or SMS; keep surveys to 1-3 questions to avoid dropoff.
Design question flows that feed product and operations teams directly: use a single CSAT question plus a mandatory free‑text field for detractors and passives, then route high‑value promoters into review or referral flows. Automate order follow‑ups to include shipment tracking, a one‑click satisfaction rating, and a soft ask for a review only after a positive rating; this sequence both raises review quality and reduces negative public posts.
More info: segment your transactional samples by cohort (new vs. repeat buyers, channel, SKU) and benchmark trends weekly-if your CSAT drops by >5 points month‑over‑month for a top 20% SKU, treat it as a priority incident with a 48‑hour investigation and root‑cause sprint.
Off‑site signals: reviews, social listening, and customer interviews
You must monitor third‑party review sites, social channels, and forums because they often surface issues before they hit support volume; set up alerts for sudden spikes in negative mentions and track sentiment by product. Reviews are conversion multipliers-products with authentic reviews typically convert much better (often double the baseline for no‑review SKUs)-so actively harvest positive experiences into your on‑site merchandising and ads.
Complement passive monitoring with proactive interviews: recruit survey respondents representing high‑LTV or high‑churn cohorts and run 30-45 minute calls with a script that maps to your hypothesis backlog. Use social listening tools (Brandwatch, Sprout Social, or free Twitter/X streams) to quantify reach and virality risk; set a threshold (for example, >100 negative mentions in 24 hours or a single post >10k impressions) to trigger executive escalation.
More info: validate off‑site signals by triangulating-if a product has a 4.2 average on your site but a sudden surge of negative reviews off‑site, prioritize qualitative interviews and order audits for that SKU within one week to confirm whether it’s a supply, fulfillment, or perception issue.
Analyzing and prioritizing feedback
Quantitative methods: segmentation, funnels, and KPI linkage
Segment feedback by cohorts that map to revenue and risk-new vs returning customers, acquisition channel, product category, and device. For example, if a cohort that represents 20% of revenue is generating 40% of negative checkout feedback, that mismatch becomes a high-priority target. Use cohort tables to surface differences: conversion rate, average order value (AOV), and refund rate across segments will show where feedback correlates with business loss.
Map feedback signals onto funnels and KPIs to estimate impact. Take a checkout friction reported in customer surveys and quantify the drop: 50,000 monthly sessions × 2% baseline conversion = 1,000 orders; fixing the issue and gaining 2 percentage points yields 1,000 additional orders. At an AOV of $80 that’s an extra $80,000 monthly, which you can use to prioritize roadmaps. Apply basic regression or difference-in-differences on A/B tests to link NPS/CSAT changes to repeat purchase and LTV, and prioritize items that move multiple KPIs simultaneously.
Qualitative methods: thematic coding, sentiment analysis, and prioritization matrices
Build a codebook and tag feedback into themes-product defects, sizing, delivery, UX, pricing-and track frequency and co-occurrence. In a sample of 1,000 product reviews you might find 320 mentions of “delivery,” with 70% of those carrying negative language; that frequency-plus-sentiment signal flags a systemic shipping issue. Use tools like Dovetail, Airtable, or simple CSV pipelines with consistent labels, and ensure inter-rater reliability by having two analysts code a subset and reconciling disagreements.
Apply automated sentiment models to scale, but validate them: run a 200-500 sample of manually labeled comments to measure precision and recall before trusting scores. For short social comments VADER is a fast baseline, while a fine-tuned BERT model typically increases accuracy for product feedback. Then score ideas with a prioritization matrix such as RICE or ICE-example RICE: Reach=5,000 affected/month, Impact=0.20 (20% lift), Confidence=0.6, Effort=20 person-days → RICE = (5000×0.2×0.6)/20 = 30-and rank initiatives by that composite score.
Operationalize qualitative insights by combining theme frequency with revenue exposure and effort estimates: escalate themes that affect >3% of orders or that generate refund/return rates above your baseline by more than 5 percentage points. You should maintain a dashboard that plots theme prevalence versus estimated monthly revenue impact so stakeholders can see why a seemingly small UX tweak may outrank low-effort cosmetic changes. Prioritize the high-impact, low-effort items first and set explicit thresholds for escalation to keep the backlog focused on what moves the business.
Converting feedback into product and UX improvements
Rapid experiments: prototypes, A/B tests, and feature flags
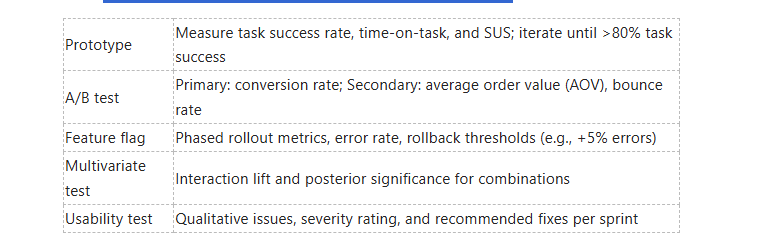
Run low-friction tests to validate hypotheses from feedback: build a clickable prototype for usability checks (testing 5 users often uncovers ~85% of obvious issues), launch A/B tests to measure conversion lift (well-designed tests commonly deliver 2-10% uplifts; outliers exceed 20%+), and deploy features behind flags so you can roll back or segment traffic without a full release. You should instrument each experiment with a primary metric (conversion rate, add-to-cart rate, revenue per session) and a secondary safety metric (return rate, error rate, page load time) to spot negative side effects early.
- Prototypes: validate flows and reduce development rework.
- A/B tests: quantify real-world impact on conversion and revenue.
- Feature flags: control exposure and ship iteratively.
- Multivariate tests: find interaction effects between multiple elements.
- Usability testing: catch friction before it reaches customers.
Recognizing how fast you can iterate and how much traffic you need for statistical power will prevent wasted experiments and reduce risk.
Prioritization frameworks: RICE, ICE, and effort‑impact mapping
Apply RICE to compare proposals quantitatively: RICE = (Reach × Impact × Confidence) / Effort, where Reach is users affected per quarter, Impact uses a 0.25-3 scale, Confidence is 0-1, and Effort is person-months. For example, a change affecting 20,000 users (Reach), with Impact=2, Confidence=0.8, and Effort=1 yields a RICE score of (20,000×2×0.8)/1 = 32,000 - a high-priority candidate versus a smaller-scope item.
Use ICE for rapid triage when you need speed: ICE = (Impact × Confidence) / Effort - it’s fast and effective for sorting dozens of ideas, but less granular than RICE. Complement these with an effort‑impact map (a 2×2): prioritize “high impact / low effort” as quick wins, plan “high impact / high effort” as roadmap bets, deprioritize “low impact / high effort,” and revisit “low impact / low effort” opportunistically.
Combine frameworks operationally: run ICE to get a short list, then apply RICE for final ranking, and use effort‑impact mapping in stakeholders’ demos so you can visually justify trade-offs and cross-check subjective bias.
Examples: common e‑commerce changes that increase sales
Improve your product pages by adding high-resolution images, 360° views, and 15-30 second product videos - retailers often see 10-25% conversion lifts from richer visuals. Simplify checkout by reducing steps (moving from five to three steps can lower abandonment by up to 20 percentage points), add saved payment methods, and expose a clear progress indicator. Implement on-site recommendations - Amazon attributes roughly 35% of revenue to personalization - and test algorithm variants to maximize AOV and repeat purchase rate.
Introduce social proof (reviews and verified purchases), a clear returns policy, and threshold-based free-shipping triggers to increase order size; urgency elements like limited-time offered discounts or inventory counters typically produce 5-8% lift but must be real to avoid trust erosion. Track returns and support tickets as safety signals so you don’t trade short-term conversion for long-term churn.
Operationally, run cohort analyses post-change (0-30, 31-90, 91-180 days) to detect whether a lift persists, monitor unit economics (margins after discounts), and flag any tests that raise warranty or return rates as high risk so you can iterate or roll back quickly.
Using feedback as social proof and marketing fuel

Publishing reviews, ratings, and customer stories to build trust
You should place star ratings, review counts, and a curated mix of positive and critical reviews above the fold on product pages; shoppers scan reviews first, and the presence of reviews can shift purchase intent dramatically-Spiegel Research Center found products with reviews are up to 270% more likely to be purchased than those without. Use structured data (schema.org) so search engines surface your ratings as rich snippets, display the overall score and number of reviews in category listings, and experiment with an excerpted “top review” and a recent negative-to-positive reply to show transparency.
Feature customer stories and short video testimonials on landing pages and homepage carousels to convert cold traffic into buyers; brands like Glossier and Away scale trust by weaving UGC into product imagery and ads. Also take care with compliance and authenticity-fake or incentivized reviews can trigger platform penalties, ad disapprovals, or regulatory fines-so publish reviews with verified-purchase badges, anonymize personal data for privacy, and include clear moderation policies to maintain credibility.
Integrating feedback into email flows, ads, and product pages
Embed short review snippets and star ratings into post-purchase and cart-abandonment emails to shorten the decision cycle; send the first review request around 7-14 days after delivery and a follow-up at 30 days-these timing windows typically produce the highest response rates, often in the 10-20% range for review collection campaigns. In product pages, surface the most helpful reviews near call-to-action areas, and add a one-line “customers also say” banner in checkout to reduce friction and returns.
Use aggregated ratings in paid channels: add seller ratings to Google Ads (which require a minimum number of reviews-typically around 100 aggregated reviews from approved sources) and pull high-rated review snippets into dynamic retargeting creatives to lift click-through rates and lower CPCs. For social ads, repurpose short video testimonials and 5-star quote cards; they outperform stock imagery when A/B tested against generic creatives.
Operationally, automate review requests and syndication with tools like Klaviyo for email flows and Yotpo or Trustpilot for on-site widgets and ad integrations, and run A/B tests on placement, wording, and timing to quantify lift-measure impact on conversion rate, average order value, and return rate so you can prioritize the highest-performing feedback assets. Be vigilant about policy compliance and authenticity checks, because a small increase in verified reviews can deliver outsized gains while fake or misused reviews can damage your account and reputation.
Operationalizing a feedback‑driven e‑commerce organization
Team structure, ownership, and cross‑functional workflows
Assign a single owner for each feedback theme (returns, product quality, UX, pricing, logistics) - typically a product manager or VoC lead - and create cross‑functional squads that include product, CX, merchandising, analytics, and operations. You should keep squads small (3-6 people) so decisions move quickly; companies that shift to this model often cut time‑to‑first‑response by >50%. Make ownership visible in your backlog: every feedback ticket needs an owner, a priority, and a required next step within 48 hours.
Implement a strict taxonomy (8-10 top categories) and enforce it with automated tagging plus human review; aim for >80% taxonomic coverage via NLP and manual spot checks for the rest. Use two cadences: a weekly triage meeting for urgent fixes and a monthly prioritization workshop that maps top themes to OKRs and experiments. If feedback has no owner or process, you get a feedback graveyard where costly issues recur - assign, tag, and timebox to avoid that.
Tools, dashboards, and SLAs for continuous feedback loops
Integrate CX platforms (Qualtrics/Medallia), reviews and UGC (Yotpo/Trustpilot), helpdesk (Zendesk/Freshdesk), analytics (Amplitude/Mixpanel), and an NLP layer (AWS Comprehend or an in‑house model) into a central data store (Snowflake/BigQuery). Build role‑based dashboards in Looker/Tableau: ops sees SLA compliance and ticket volume, product sees theme velocity and conversion impact, and merchandising sees SKU complaint density. Focus KPIs on volume, sentiment trend, NPS/CSAT deltas, and issue‑to‑fix time - for example, track the % of critical issues triaged within 24 hours and the median days to resolution.
Define SLAs that balance speed and signal quality: triage SLA of 24-48 hours for severity‑1 issues, 72 hours for standard issues, and a resolution target of 14 days for product defects (with 48-72 hour customer updates). Set measurable targets like closing 80% of tickets within SLA and keeping NLP classification precision above 85%. Without clear SLAs you create alert fatigue and slow remediation; with them, you signal to customers that you act on feedback and can reduce churn.
Design dashboards to surface actionable insights: include a heatmap of complaint density by funnel step, top 10 SKUs by return rate, a sentiment time series, and a backlog funnel (new → triaged → in‑work → resolved). Link each insight tile to a workflow action (create ticket, launch experiment, escalate to ops) and instrument A/B tests for hypothesis validation; run monthly taxonomy audits and retrain models until automated tagging precision stabilizes >85% to avoid misrouting high‑impact issues.
Conclusion
Following this, you can turn customer feedback into a continuous engine for growth by systematically collecting, analyzing, and acting on insights to improve product listings, user experience, and customer service. By prioritizing high-impact changes, validating them through A/B tests, and showcasing authentic reviews, you increase conversions and strengthen trust in your brand.
When you close the loop by communicating improvements to customers and using feedback to personalize offers, you drive higher retention and repeat purchases; measuring the impact on key metrics lets you iterate rapidly and sustain long-term sales growth.
FAQ
Q: How should I collect customer feedback so it’s actionable for improving e‑commerce sales?
A: Use a mix of quantitative and qualitative channels: post‑purchase surveys (NPS, CSAT), short product ratings on product pages, on‑site feedback widgets, email follow‑ups after delivery/first use, live chat transcripts, and public reviews with photo/video uploads. Time requests to key moments (after delivery, after first use, after customer support interactions). Ask one or two specific rating questions plus one open text field for context. Offer low‑friction incentives (discount on next purchase or entry in a prize draw) sparingly to boost response rates. Track response rate, NPS/CSAT trends, and distribution of ratings to know which signals are reliable for action.
Q: What’s an efficient process to analyze feedback and turn it into priorities?
A: Centralize feedback in a dashboard and tag entries by theme (product quality, sizing, shipping, pricing, UX). Combine frequency counts with sentiment analysis for a quantitative view and read representative verbatim comments for nuance. Map issues to revenue impact (number of orders affected × conversion/return cost) and effort to fix, then prioritize using an impact × effort matrix. Use cohort analysis to see if complaints concentrate on certain SKUs, suppliers, or customer segments. Translate top themes into concrete experiments or fixes with owners, deadlines, and success metrics (conversion lift, reduced returns, improved NPS).
Q: How can I use customer feedback to boost conversion rates on product pages?
A: Surface authentic social proof: prominent average rating, recent reviews, top pros/cons, and user photos or videos. Add a succinct “what customers mention most” summary (e.g., “customers say this fits true to size and holds up well in rain”). Highlight changes made because of feedback (e.g., “updated zipper after customer suggestions”) to show responsiveness. Implement a Q&A section where prospects can see answers to common concerns. A/B test placement and format of reviews, UGC galleries, and testimonial snippets; measure effects on add‑to‑cart rate, conversion rate, and bounce rate. Use review filters (size, use case) so shoppers find relevant feedback faster.
Q: How should negative feedback be handled so it doesn’t hurt sales and can actually help grow trust?
A: Respond publicly and promptly with empathy, a clear resolution path (refund, replacement, troubleshooting steps), and a private follow‑up to confirm satisfaction. Track time‑to‑resolution and resolution rate as operational KPIs. Aggregate recurring complaints to identify product defects or UX failures and prioritize fixes; then publish updates that show the problem was addressed. Turn resolved negative experiences into trust signals by asking satisfied customers to update their review and using a “we fixed this” badge on affected product pages. Use negative feedback in internal training to reduce repeat issues.
Q: How can feedback be integrated into marketing, product roadmap, and personalization to increase lifetime value?
A: Feed categorized insights to product and supply teams to guide roadmap priorities and defect corrections. Use testimonial snippets and high‑value review quotes in email campaigns and ads targeted to segments that expressed similar needs. Segment customers by feedback themes (e.g., price‑sensitive, quality‑focused, feature‑driven) and personalize offers and product recommendations accordingly. Run experiments where messaging reflects verified customer language and measure A/B lift in open rate, click‑through, conversion, and repeat purchase rate. Monitor downstream KPIs-reduced returns, higher AOV, improved retention, and rising NPS-to validate that feedback‑driven changes increase lifetime value.